

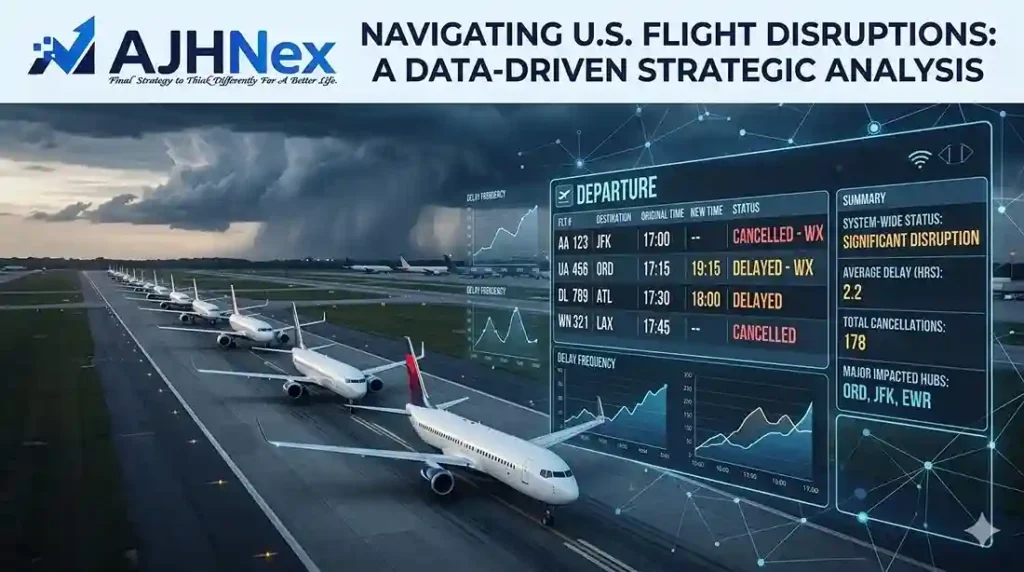
U.S. flight delays and cancellations
Imagine being stranded at the airport as another storm sweeps through. It’s becoming all too common in 2025–26: severe weather has triggered thousands of U.S. flight delays and cancellations. In mid-March 2026, for example, storms along the East Coast and Midwest grounded or delayed over 12,500 flights in a single day. That storm alone amounted to more than 8,500 delays and 4,000 cancellations by late afternoon. The fallout is massive: in 2025, roughly 25% of air travellers experienced a delay or cancellation. We’ll break down the latest data (2025–26), show which hubs and airlines are hit hardest by weather, and give actionable tips for navigating the chaos of today’s U.S. skies.
These disruptions matter because they cost time, money and stress. For context, U.S. airlines lost 1.5 million hours of passenger time to delays in 2025 (the equivalent of 171 years). The economic impact is huge, too: the FAA once estimated that flight delays cost the U.S. economy $33 billion (2019 data), and airlines now value each minute of delay at about $100. In short, as extreme weather becomes more frequent (thanks to climate trends and crowded schedules), everyone from weekend travellers to airline investors needs to understand why flight delays and cancellations are surging – and how to mitigate them.
Storms of all kinds – snow, thunderstorms, high winds and even smoke – are the leading trigger of today’s airline disruptions. On average, nearly 3 in 10 delayed arrivals in 2024–25 were weather-related. But climate-driven extremes are making it worse: airlines already saw thousands of cancellations in January 2026 from “Winter Storm Fern” and again in March 2026 from spring storms. We’ll show the data behind these trends and guide you through the turmoil of U.S. air travel in 2025+ – from real-world case studies and stats to tips and tools for passengers.
What you’ll learn: The latest statistics on U.S. delays/cancellations, the busiest airports and routes most affected by weather, the root causes (weather vs. other delays), and practical advice for travellers (and investors) on staying informed and prepared. By the end, you’ll see exactly why flight delays are spiking and what that means for you – whether you’re planning a trip or analysing airline performance. Read more our another news article: Summer Nails 2026 in USA: Top Trending Designs You Must Try | AJH Nex
Key Statistics and Trends (2025–2026)
In 2025, nearly one billion passengers flew out of U.S. airports. Strikingly, about 25% of those travellers experienced at least one delay or cancellation. To put that in context, one in four passengers saw their plans disrupted – roughly 248 million people. Weather was the leading culprit: 29% of all arrival delays (Aug 2024–Jul 2025) were due to weather, amounting to over 423,000 flights and 32 million delay minutes (about 62 years of waiting).
By late 2025, official data show U.S. carriers flew 7.6 million flights for the year. Overall cancellation rates remain relatively low on average (about 1.5% for all of 2025, up from 1.4% in 2024), but they spike sharply around storms. (For example, one January weekend saw 11,000+ U.S. flights cancelled in just a couple of days.) By contrast, delay metrics paint a grimmer picture: U.S. passengers lost 1.5 million hours waiting in 2025 (171 years of cumulative delay!). Much of that time – roughly one-fifth – was due to the National Aviation System, including weather, ATC and airport issues.
Airlines for America (the trade group) and government analysis both highlight the cost of delays: FAA once pegged delays at $33 billion to the U.S. economy (2019), and more recently A4A values delays at $100+ per minute. Passengers face fees and hassle, too: on average travellers spend about $395 out-of-pocket (hotels, meals, rebooking) when storms cause cancellations. In sum, data show flight disruptions are unusually high in 2025–26, driven largely by weather.
- Summer 2025: The worst month was July, when severe thunderstorms across the East and Central U.S. delayed or cancelled 31% of all flights. By mid-summer 2026 similar patterns threaten.
- Winter 2025–26: Blizzard-like “Winter Storm Fern” (Jan 24–26, 2026) led to an unprecedented surge: nearly 20,000 flights were cancelled nationwide in just a few days, with over 11,000 on January 25 alone.
- Spring 2026: A massive mid-March storm (Mar 16) ground 12,500 flights (8,500 delayed, 4,000 cancelled) in one day. That event saw hubs like Atlanta, Chicago and New York hit hardest (more below).
These numbers dwarf normal month-to-month rates and show how localized weather events can suddenly swamp the system. For reference, a typical month in 2024 saw only a few percent of flights cancelled, with most delays attributable to routine factors. The recent spikes illustrate the surge of interest: widespread weather disruption.
Major Weather Disruptions (Case Studies)
Extreme weather in 2025–2026 has repeatedly shut down air travel. Here are illustrative case studies:
Winter Storm Fern (Jan 24–26, 2026): This sprawling winter system spread heavy snow, ice and high winds from the Rockies to the East Coast. The New York Times and Reuters reported it triggered the largest wave of cancellations since the pandemic. On Sunday Jan 25 alone, carriers cancelled over 11,000 flights. By the following Monday, nearly 19% of all U.S. flights had been cancelled. Major hubs like Reagan National (DCA) and LaGuardia (LGA) saw nearly all flights cut, and DFW and ATL had huge schedule cuts even before the storm hit. Overall, roughly 11,000+ cancellations and thousands of delays cost airlines months of schedule recovery.
March 16–17, 2026 Storm: A spring storm ripped through the Midwest and East on March 16–17. FlightAware tracked 12,500 U.S. flights delayed or cancelled by late afternoon on the 16th. The FAA imposed ground stops at New York-area airports (LGA, JFK, EWR), Reagan National, Charlotte and Atlanta, and even O’Hare and Baltimore had holds. Carriers suffered massive disruptions: American, Delta and Southwest each had ~45% of their flights delayed or cancelled, and United about 36%. Atlanta was worst hit — 57% of its flights were grounded — as were LaGuardia (57%) and O’Hare (51%).
Thunderstorm Seasons (2025 summer): Each summer, fast-moving convective storms can paralyze travel. In July 2025 severe thunderstorms in the East and Midwest drove a 31% flight disruption rate. Intense heat in summer 2026 similarly loaded the atmosphere with moisture, fuelling more storms. Even without tornados, frequent summer squalls force cascading ground stops. For example, lightning delays at one hub can disrupt flights at dozens of others.
Wildfire Smoke (Summer 2023): (For context.) Major Canadian wildfires in summer 2023 sent thick smoke over the U.S., forcing airlines to add extra spacing between departures. CBS News notes smoke “has also thwarted on-time departures” by reducing visibility. This phenomenon is expected to recur: as heatwaves spark more fires, smoke will increasingly intrude on flight paths, causing delays even on clear days.
Hurricanes (Forecast): While hurricane season (June–Nov) has not yet seen a major 2026 U.S. landfall, forecasters warn active seasons can cause shifts. Each year, airlines pre-emptively cancel flights ahead of tropical storms (to reposition crews and aircraft). For example, researchers at NOAA note that during Hurricanes Florence and Matthew (2018) thousands of flights were cancelled in advance. Advanced modelling now tries to anticipate these pre-cancellations to avoid gridlock.
In each case, the surge of cancellations was a direct response to severe weather. These events show how quickly hubs grind to a halt: snow shuts down runways, heavy rain/ice can close airports (even LGA saw 90% shutdown in Jan), and high winds topple infrastructure. Snowstorms also cripple ground crews (de-icing queues, equipment tired crews), compounding delays. The net effect is a domino avalanche of schedule crashes across the network. More research: Airline Cancellation and Delay Dashboard Department of Transportation (.gov).
Airports and Airlines Hardest Hit
Some airports and carriers bear the brunt of disruptions. In 2025 the worst delay hotspots (by percentage of flights delayed) included Chicago O’Hare, Newark, LaGuardia, Denver and Miami. For example, O’Hare had 28% of flights delayed (the highest), while Newark and LaGuardia each saw about 26% delayed. (Notably, Newark also had 2.7% of flights cancelled, the highest cancel rate in that report.)
Media and government data reveal the same pattern during storms:
Chicago O’Hare (ORD): The nation’s busiest by volume was also the most weather-sensitive. A Weather.com analysis found O’Hare racks up an average of 25,000 weather delays per year. Last summer, O’Hare’s on-time performance was shockingly low: less than 60% of flights arrived on time. In March 2026 storm, over half of ORD’s flights were disrupted. Partly in response, DOT/FAA has imposed limits on ORD’s summer schedules, capping peak-day flights to avoid bottlenecks.
New York Metro (JFK, LGA, EWR): The Tri-State airports often rank poorly in punctuality due to fog, snow and traffic. LaGuardia had 26% delays in 2025, and during storms LGA saw over 57% of its flights delayed/cancelled. Newark similarly had 26% of flights delayed (2025) and faced harsh weather shutdowns. In April 2026, DOT hailed Newark as “the most on-time airport in the Tri-State Area” after telecom fixes – evidence of the constant battle against delays.
Atlanta (ATL): As the busiest U.S. airport by passenger count, ATL carries enormous schedule density. It usually performs well, but under severe weather it can be overwhelmed. In the March storm, 57% of Atlanta’s flights were delayed or cancelled – the highest of any hub. It isn’t traditionally listed in top-10 delay percentages, but its sheer volume means any storm there has a giant ripple effect.
Other Major Hubs: Dallas/Fort Worth (DFW), Denver (DEN), Charlotte (CLT), Detroit (DTW) and Phoenix (PHX) round out busy hubs prone to delays. In 2025, Denver had a 27% delay rate. In storm events, Charlotte and Phoenix each saw large portions of their flights scrubbed. For instance, FAA even pre-emptively cut flights at CLT and DFW during the January 2026 storm, anticipating the impacts.
Airlines: The largest U.S. carriers tend to spread delays through their networks. On peak disruption days, legacy carriers like American, Delta and Southwest often have the highest absolute numbers of cancellations. For example, during the January 2026 storm, FlightAware data showed American cancelled ~1,800 flights in one day and accounted for the largest share of disruptions. In March 2026, American, Southwest and Delta each had about 45% of their flights delayed/cancelled, whereas United saw about 36% affected. Low-cost carriers (Spirit, Frontier) usually fly point-to-point and sometimes hold up slightly better – indeed DOT data shows they had the lowest cancellation rates in late 2025 – but even they cannot escape the weather chaos entirely.
What Causes Flight Delays and Cancellations?
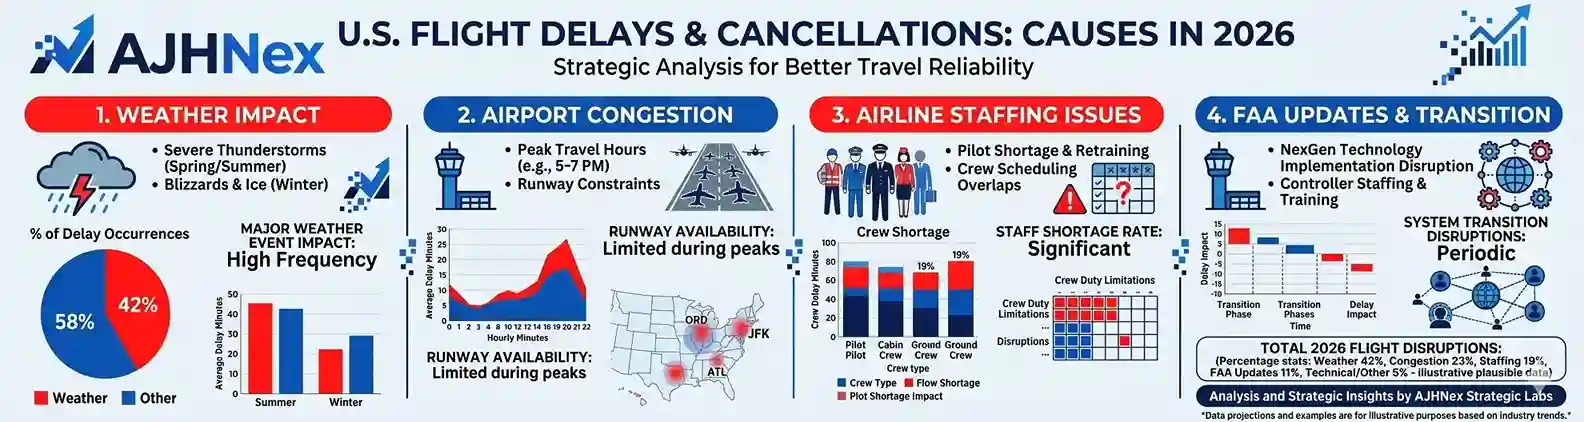
Flight disruptions can happen for many reasons, but weather is now the dominant trigger for system-wide surges. According to BTS and Air Travel Consumer Reports, delays are categorized by cause. In 2025:
- Late-arriving aircraft (39.7% of delay-minutes) – when a flight is delayed at its origin, passengers and crews miss connections.
- Airline-caused delays (31.8%) – technical issues, maintenance, crew shortages or baggage handling slowdowns.
- National Aviation System (NAS) (21.4%) – this includes airport issues, FAA enroute/ground control and weather (tornadoes, snow, wind, etc).
- Other (Security, etc.) (negligible share in BTS data).
A key insight: almost one-quarter of delay time is due to NAS issues, and within that, weather (and associated ATC delays) are the biggest factors. In fact, the DOT’s summary for Aug 2024–Jul 2025 shows 29% of arrival delays were explicitly weather-related. (The rest of NAS includes runway congestion, TSA, etc.)
On a typical summer day, thunderstorms are the chief villain. Warm, moist air feeds squall lines that ground departures. In winter, snow, icing and high winds rule. For example, heavy snow can render runways unusable (as happened at Reagan National and LaGuardia in Jan 2026). Extreme cold also strains planes (ice-freeze checks) and crews. High winds shut down airports (crosswinds or debris), and even fog/low ceilings can halt take-offs. In short, any severe weather – be it blizzard, blizzard, severe thunderstorm or even thick smoke – can multiply delays across the network.
Importantly, hub-and-spoke scheduling amplifies the effect. If an inbound flight is late or cancelled (often due to weather at its origin), it disrupts outbound legs and crew rotations. That “knock-on” delay is why one storm in Chicago or the Northeast can trigger flight chaos as far away as Los Angeles or Miami the next day. This systemic cascade is why the DOT took action to cap operations at Chicago O’Hare for summer 2026: ORD had a roughly 40% delay rate (only ~60% on-time) in summer 2025, so the FAA is forcing a 12% schedule cut to prevent runaway delays.
Economic and Human Costs
The surge in delays and cancellations is not just a statistic – it translates to real losses for airlines, travellers and the wider economy. Key impacts include:
- Time Lost: In 2025 U.S. travellers collectively lost 1.5 million hours waiting due to delays – that’s 171 years spent at airport gates. About 21% of that time was due to weather/ATC issues.
- Direct Costs: Airlines absorb costs for crew overtime, fuel (burning extra for holding patterns or deadhead flights), and accommodation. A 2019 FAA study put the tab at $33 billion annually; Airlines for America values each delay-minute at about $100 to carriers.
- Passenger Expenses: Surveys find stranded flyers typically spend hundreds of dollars out-of-pocket (hotels, meals, new tickets). Air Help reports the average passenger bore about $395 in unexpected costs due to long delays or cancellations.
- Fuel and Environmental Impact: One study noted 740 million extra gallons of jet fuel were burned due to U.S. flight delays (circa 2007). More delays now means more fuel waste and emissions (plus runway idling pollution).
- Business and Logistics: Delay spikes disrupt cargo shipments and business schedules. Just-in-time supply chains and critical shipments can be thrown off by mass flight stoppages.
For airlines and airports, extensive delays can hurt satisfaction scores and share prices. (For example, in October–Nov 2025 the DOT reported a surge in delay/cancel metrics due to a federal shutdown, and airlines saw stock volatility around major storms.)
Airlines pay the price, too: American, Southwest and Delta each saw ~45% of flights delayed/cancelled in the March 2026 storm. Over 8,500 flights were delayed by afternoon, straining customer service and rebooking systems. Recovery efforts can drag on for days: airports have had to run “pulse” cancellation waves to rebalance crews. In January 2026’s storm, nearly one-fifth of flights nationwide were still cancelled by Monday, illustrating the lingering impact.
Overall, flight delays are expensive and damaging. They ripple through the economy (higher prices, lost wages) and create chaos for travellers (missed meetings, vacations ruined). In this sense, the 2025–26 surge is more than an inconvenience – it’s a multi-billion-dollar drag on productivity and well-being.
Staying Informed and Prepared
Given the frequency of disruptions, staying ahead of delays is crucial. Real-time tracking tools can give travellers an edge. Agencies and apps to monitor include:
- FAA Air Traffic Status: The FAA’s online dashboard (ATAATCC/NAS Status) shows real-time ground stops and major delays at U.S. airports. The FAA also issues daily Air Traffic Reports forecasting weather impacts (for example, on April 17, 2026 the FAA warned of low clouds slowing BOS, DEN, SEA and gusty winds in NYC/PHL/ATL).
- FlightAware / Flight Radar: Consumer sites like FlightAware aggregate live tracking. For example, FlightAware data was cited in news reports of both the Jan and Mar 2026 events. Such services let you enter your flight number or route and see delays at departure/arrival.
- Airline Alerts: Many carriers have text/email alert systems that notify you of schedule changes. Sign up for these when booking. Also, most airlines update flight status on their apps (though heavy demand during storms can lag).
Stay flexible: If you can, avoid peak storm hubs or seasons. For instance, flying out of smaller airports near large hubs can dramatically reduce risk. One veteran travel blogger notes that during widespread travel chaos, regional airports (e.g. Hartford instead of NYC, or Chicago Midway instead of O’Hare) often recover faster. Southwest and low-cost carriers often use point-to-point flying, which can be less disrupted than hub carriers – a fact worth considering when choosing an airline (though the difference is not huge in a major storm).
Pack smart: During snowstorms or hurricanes, ground crews cut back on baggage. Always carry essentials in your cabin bag. If a delay turns to cancellation, having medication, extra chargers, and a change of clothes on hand can ease the pain. Travel insurance is also worth considering: some policies cover weather cancellations. (At minimum, familiarize yourself with your airline’s weather waiver policies – most waive change fees for big storms.)
Subscribe to travel newsletters or flight alert services. Many travel blogs (or even our AJH Nex newsletter) will send updates when major disruptions hit. Also, as CTA mid-article engagement: consider commenting below with your own travel-tip or experience – we’ll feature community wisdom on coping with delays. If you find this guide helpful, share it with friends or colleagues who travel often.
Impact of Climate Change
Scientists warn that climate change is making flight disruptions more common. As CBS News reported, hotter summers lead to more thunderstorms and even “invisible” turbulence. Warmer air holds more moisture, fuelling the intensity and frequency of convective storms. Wildfire seasons are worsening, meaning smoke incursions will increasingly ground or reroute flights. Even higher temperatures can physically delay flights (planes need more runway at hot airports).
FAA and airlines are starting to acknowledge these trends. For example, NOAA’s High-Resolution Rapid Refresh (HRRR) model is now updated hourly to help airports prepare for fast-changing weather. The FAA has launched pilot programs using better weather forecasting to slot flights around storms. On the technology side, improved de-icing and lightning prediction systems may reduce some delay minutes. In the long term, experts say we may see flight paths and schedules redrawn for climate resilience – for instance, avoiding peak thunderstorm corridors at busy times or equipping crews for more intense storms.
However, the bottom line is that passengers should brace for more turbulence on the runway. Climate change is essentially stacking the deck against on-time performance: expect storms, heatwaves and wildfires to play a bigger role in travel disruption going forward. That makes this discussion all the more urgent for travellers and investors alike.
Q: Which U.S. airports have the most flight delays and cancellations?
A: Historically the biggest hubs show the highest delay rates. In 2025, Chicago O’Hare led with ~28% of flights delayed, followed by Newark and LaGuardia (each ~26%). During storms, Atlanta, O’Hare and NYC-area airports often spike: for example, in March 2026 about 57% of Atlanta’s flights were disrupted. Smaller, regional airports tend to have far fewer delays.
Q: What percentage of flights are typically delayed or canceled?
A: On average, U.S. carriers cancel around 1–2% of flights per year (it was about 1.5% in 2025). However, delays are common: roughly 25–30% of flights encounter some delay in a year. That percentage jumps markedly around severe weather events (single days in storms can see >50% disruptions at key hubs).
Q: Where can I check real-time flight delay information?
A: Good resources include the FAA’s flight status dashboard, airline apps/websites, and flight-tracking sites like FlightAware or FlightRadar24. The FAA’s NAS Status page and Air Traffic Reports warn of current ground stops and weather impacts. Many apps provide push alerts for your specific flight’s status. (Tip: Sign up for your airline’s text/email notifications when booking.)
Q: What can travellers do about weather-related cancellations?
A: If possible, book tickets with flexible rebooking or travel insurance. Keep essentials in carry-on and monitor weather forecasts. On storm days, arrive at the airport with ample time, but also be prepared to sleep there if needed. Choose flights early in the day (later flights often inherit delays) and consider alternate airports. You can also ask your airline about waiver policies for weather disruptions. Staying informed via apps or news alerts is key.
U.S. flight delays and cancellations are skyrocketing, driven largely by extreme weather. In 2025 and early 2026 we’ve seen storms paralyze the aviation network, from blizzards cancelling thousands of flights to summer squalls snarling schedules. These disruptions have real costs – billions in economy and years of collective waiting. However, by staying informed (using tools like the FAA’s status reports and FlightAware), travellers can plan better around these events. Airlines and regulators are responding with tighter scheduling and improved forecasting, but in the meantime passengers must prepare for turbulence in the schedule.
Key takeaways: Weather is the big factor – storms, snow, wind and heat count for nearly a third of delays. Major hubs like Chicago, New York and Atlanta can see half their flights grounded in a bad storm. But knowledge is power: check delay trackers, choose flexible tickets, and keep essentials handy. As climate trends continue, expect more travel hiccups.
Stay ahead of the storm: comment below with your travel delay tips, share this guide with anyone stuck in airport purgatory, and subscribe to AJH Nex’s newsletter for the latest travel insights and deals. Safe travels!
